Raster versus vector spatial data
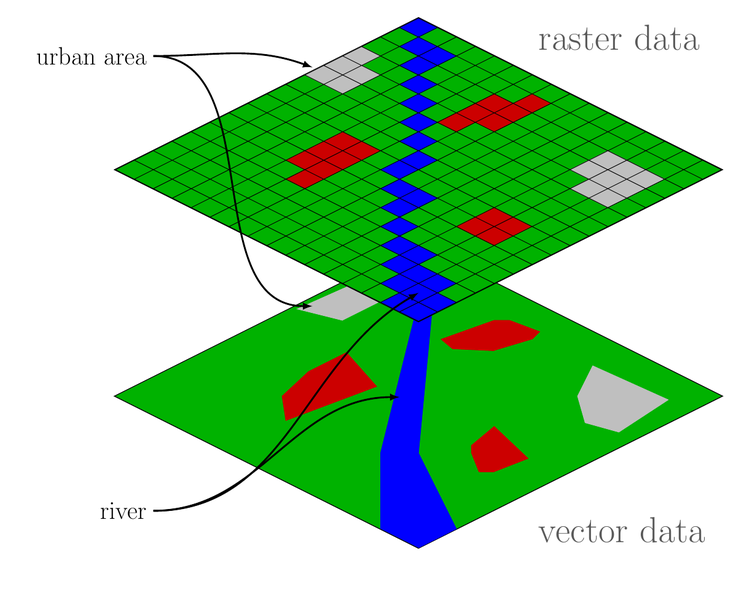
Vector spatial data describes the world using shapes (points, lines, polygons, etc).
Raster spatial data describes the world using cells of constant size.

The choice to use vector or raster data depends on the problem context. We will focus on vector data.
Source: https://commons.wikimedia.org/wiki/File:Raster_vector_tikz.png
Click the link below to create the repository for lecture notes #06 -https://classroom.github.com/a/SwGmBhHJ
Follow the steps to clone the repo, make a new RStudio project, and configure
git. Change the author name in the YAML header of lecture06.Rmd to your name
and update the date to today's date.
Complete the Lab Team Formation Survey by 2-09 11:59 PM. Do this now if you have time.
Simple features have a geometry type. Common choices are below.

Map Layers
The North Carolina Department of Environment and Natural Resources, Wildlife Resources Commission and the NC Center for Geographic Information and Analysis has a shapefile data set available on all public Game Lands in NC.
nc_game <- st_read("data/gamelands.shp", quiet = TRUE)ggplot(nc_game) + geom_sf() + theme_bw() + labs(title = "North Carolina gamelands")
ggplot(nc_game) + geom_sf(fill = "#ff6700") + theme_bw() + labs(title = "North Carolina gamelands")
ggplot(nc) + geom_sf() + geom_sf(data = nc_game, fill = "#ff6700", alpha = .5) + theme_bw() + labs(title = "North Carolina gamelands and counties")
ggplot(nc) + geom_sf() + geom_sf(data = nc_game, aes(alpha = SUM_ACRES), fill = "#ff6700") + theme_bw() + labs(title = "North Carolina gamelands and counties", fill = "Acres")


